Deprecated
Load the snRNA-seq data and the required libraries:
# single-cell analysis package
library(Seurat)

# plotting and data science packages
library(tidyverse)
library(cowplot)
library(patchwork)

# co-expression network analysis packages:
library(WGCNA)
library(hdWGCNA)

# network analysis & visualization package:
library(igraph)

# packages for TF motif analysis
library(JASPAR2020)
library(motifmatchr)
library(TFBSTools)
library(EnsDb.Hsapiens.v86)
library(GenomicRanges)

# using the cowplot theme for ggplot
theme_set(theme_cowplot())

# set random seed for reproducibility
set.seed(12345)

# load the Zhou et al snRNA-seq dataset
seurat_ref <- readRDS('data/Zhou_control.rds')
Run Motif scan:
# get the pfm from JASPAR2020 using TFBSTools
pfm_core <- TFBSTools::getMatrixSet(
  x = JASPAR2020,
  opts = list(collection = "CORE", tax_group = 'vertebrates', all_versions = FALSE)
)

# run the motif scan with these settings for the mouse dataset
seurat_obj <- MotifScan(
  seurat_obj,
  species_genome = 'hg38',
  pfm = pfm_core,
  EnsDb = EnsDb.Hsapiens.v86
)
dim(GetMotifMatrix(seurat_obj))


# TF target genes
target_genes <- GetMotifTargets(seurat_obj)

# check target genes for one TF:
head(target_genes$SOX9)
Output
[1] "OR4F5" "TTLL10" "SDF4" "ATAD3C" "MIB2" "CDK11B"Overlap between TF target genes and co-expression modules
# overlap between modules & TF target genes:
seurat_obj<- OverlapModulesMotifs(seurat_obj)

# look at the overlap data
head(GetMotifOverlap(seurat_obj))
Output
module           tf      color odds_ratio       pval        fdr
Arnt         INH-M1         Arnt lightgreen  1.8100972 0.04229064 0.06409755
Ahr::Arnt    INH-M1    Ahr::Arnt lightgreen  1.9306874 0.01521384 0.02637231
Ddit3::Cebpa INH-M1 Ddit3::Cebpa lightgreen  1.4769054 0.17180719 0.21395236
Mecom        INH-M1        Mecom lightgreen  1.1494048 0.39598290 0.43952275
FOXF2        INH-M1        FOXF2 lightgreen  1.7265993 0.06967679 0.09851950
FOXD1        INH-M1        FOXD1 lightgreen  0.8656827 0.68554365 0.71222835
      Significance     Jaccard size_intersection
Arnt                      0.002775575                14
Ahr::Arnt               * 0.002818573                19
Ddit3::Cebpa              0.002379819                10
Mecom                     0.001917546                10

FOXF2                     0.002699663                12
FOXD1                     0.001482800                 5
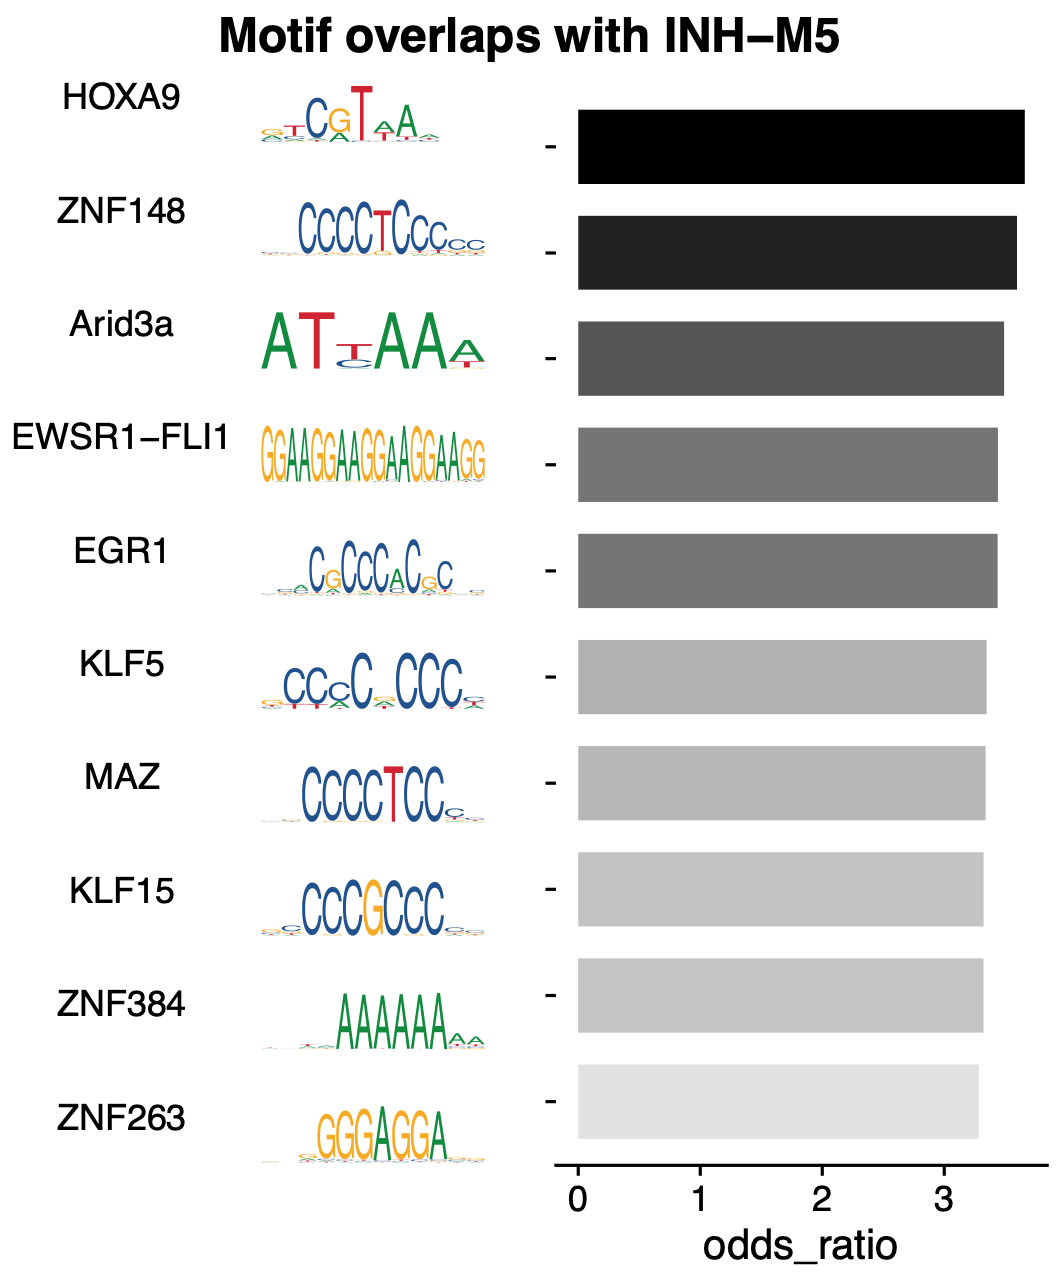
# plot the top TFs overlapping with
MotifOverlapBarPlot(
  seurat_obj,
  #motif_font = 'xkcd_regular',
  outdir = 'motifs/MotifOverlaps/',
  plot_size=c(5,6)
)
Compute motif target gene expression score:
Plot overlap between motif of interest and modules:
df <- GetMotifOverlap(seurat_obj)

cur_df <- df %>% subset(tf == 'SOX9')

plot_var <- 'odds_ratio'
p <- cur_df %>%
  ggplot(aes(y=reorder(module, odds_ratio), x=odds_ratio)) +
  geom_bar(stat='identity', fill=cur_df$color) +
  geom_vline(xintercept = 1, linetype='dashed', color='gray') +
  geom_text(aes(label=Significance), color='black', size=3.5, hjust='center') +
  ylab('') +
  xlab("Odds Ratio") +
  ggtitle("SOX9 overlap") +
  theme(
    plot.title = element_text(hjust = 0.5)
  )


png(paste0(fig_dir, 'Sox9_motif_overlap_or.png'), width=3, height=4, units='in', res=400)
p
dev.off()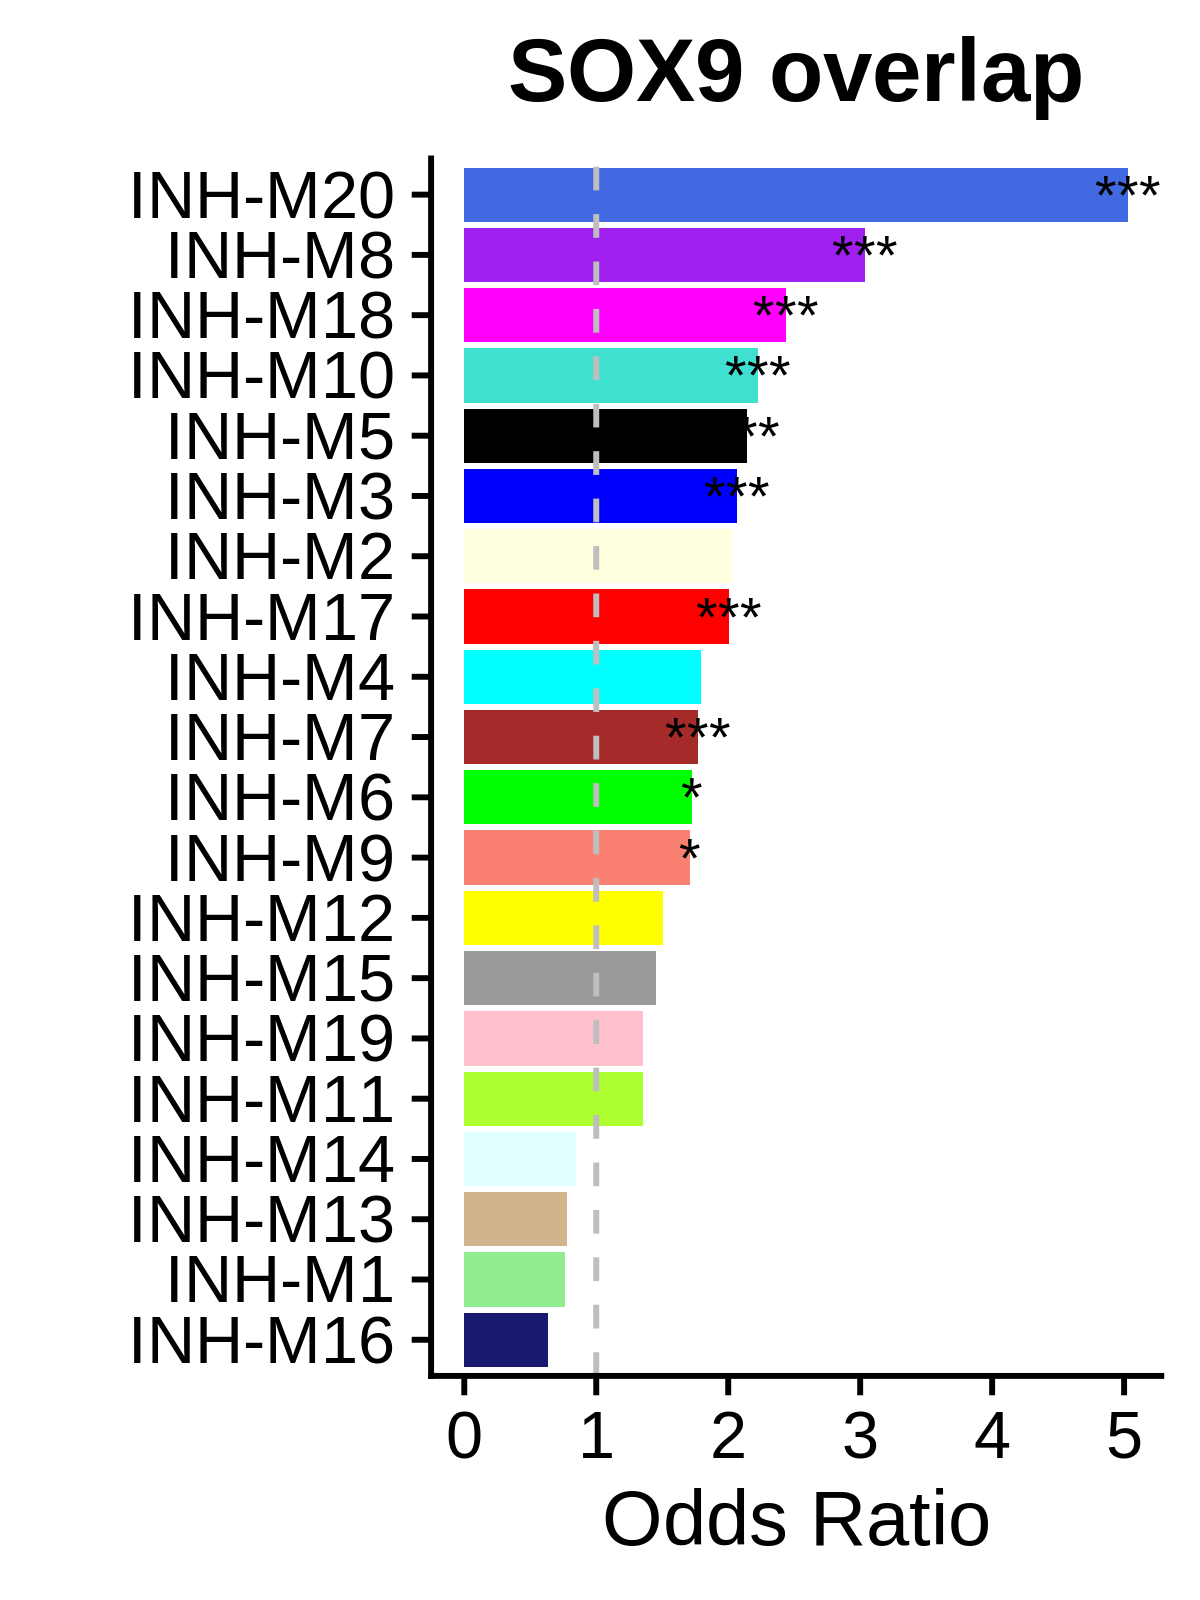
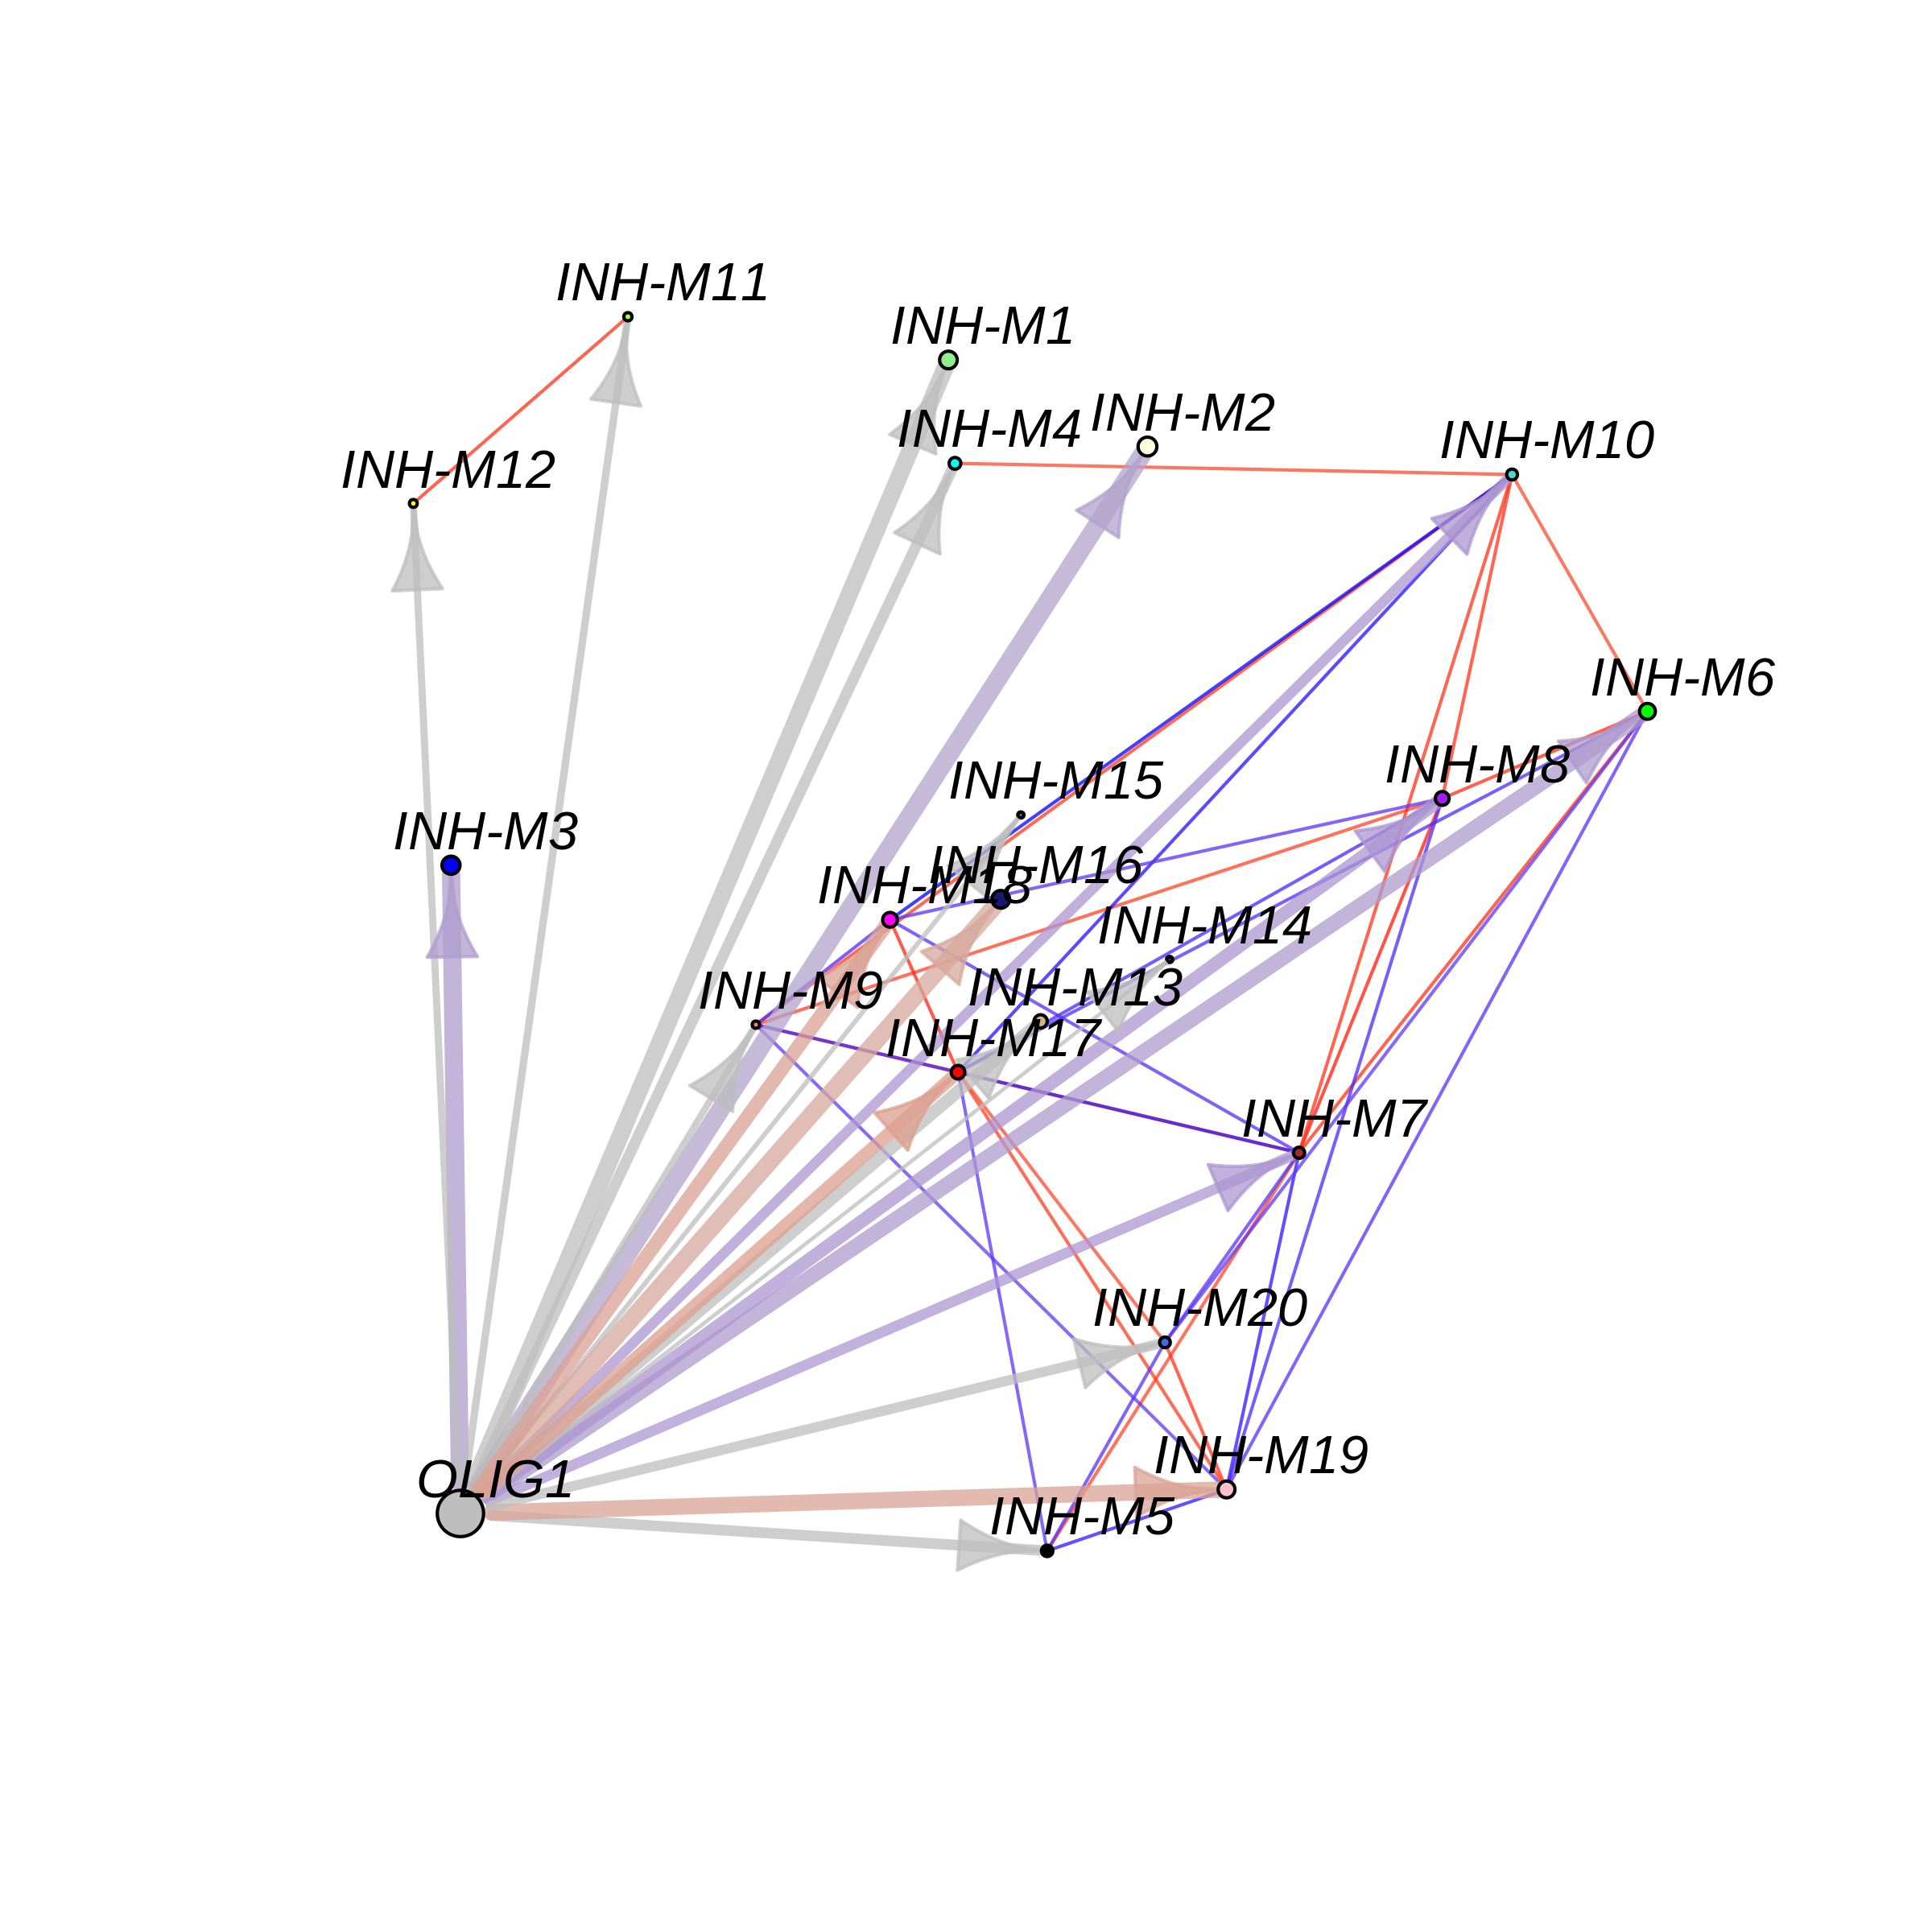
Motif overlap network
ModuleTFNetwork(
  seurat_obj,
  edge.alpha=0.75,
  cor_thresh = 0.75,
  tf_name = "OLIG1",
  tf_gene_name = "OLIG1",
  tf_x = -7,
  tf_y = -7
)